What is behind the Wyckoff Trading Method and the Supply and Demand willing? Why do the Supply and Demand Imbalances define the price moving? Besides, why do they rule the price consolidation and the trend? Many people don’t know about the real structure of the Markets. Let me show the hinges of the trading negotiation.
When you analyze the market you see the price that is moving and how it reacts converging to big orders. In the same way, you recognize where the price is going. So you see the direction that it takes and how the moving happens. Besides, you understand the role that a Price Consolidation has in all this. Indeed, you see how the institutional investors work into the Range of Consolidation.
Describe all this, describe also how I trade and invest in Stocks and Bonds so as in Forex and Futures. I have not to look for perfection to get my profits. But I need to have clear the Structure of the Markets where I invest. Then, I need to understand what rules the Price Range of Consolidation and the Trend Rotation. Then, why the price moves in a specific way. Besides, I have to understand why it spikes up or down and how it is running.
The Supply and Demand Imbalances shows how Big Block Orders act. The Wyckoff Trading Principles are the root of any Stock market technique. In the same way, it is so for any other marketplace: Forex, Futures, Bonds and much more.
Every marketplace, Liquid or Non-Liquid, is the result of Orders that move the price.
Even if I earn in a constant way for the long-term, my learning process never ends. What I do with the Students of Profiting.Me is sharing with them my Trading Practice. Then they see the practical applications of my knowledge and experience.
How Big Investors take their Block Trades
Block Order
A Tradable Financial Asset is a Security. When Institutions or Traders set a Buy or Sell Block Order, they take a large number of Securities.
A large number of Securities is an amount of shares that is very high. For Penny Stocks Traders 10.000 could seem like a very big amount of shares. On Liquid Markets, Institutions can engage 100.000 shares as a starting point. Later, they can increase their exposure taking more shares. I am talking about hundreds of thousands of dollars so as several millions of dollars on Orders.
The Wyckoff Trading Method so as Supply and Demand Imbalances are all around Block Orders and Block Trades.
Block Trade
These Big Orders, that are Blocks of Securities, create Block Trades.
Involving a big number Securities, such Bulk of Trades can move the market in a consistent way. This is possible by the rising of the volume of negotiations.
It is almost impossible for a simple retail trader to trade such big sizes. Indeed, It is a prerogative of Hedge Funds and Institutional Investors. They inject a large amount of money to the market by Intermediaries so as Investment Banks.
Block House
A Block House is a particular brokerage firm that is specific for large trades, charging high fees to the Investors.
It manages the big investments for Pension Funds, Academic Funds, Corporations, Banks to Insurance, and more.
It gives several services for big investments. But what is relevant is that a Block House trades the Big Block Orders in a careful way.
A Block House can manage the money with the focus on these points:
- It manages the investment avoiding to induce high volatility to the market.
- Keeping relations with brokers, it split the Block Order to different brokers.
- It can inject the money into the market increasing the exposure in a gradual way looking to push the price.
- Even if the Investor decides the Order Price, it looks for the best deal for trades.
A Block House has skills and relations to manage, in an easy way, orders of a big number of Securities.
In the modern age of Trading and Investing, the Block House seems like a broker with a direct account manager. The difference is that the Block House manages Millions of Dollars per trade. It is possible because the authority legitimises the Block House to get the necessary specialization to do it.
How the Block House manages Block Orders and Block Trades
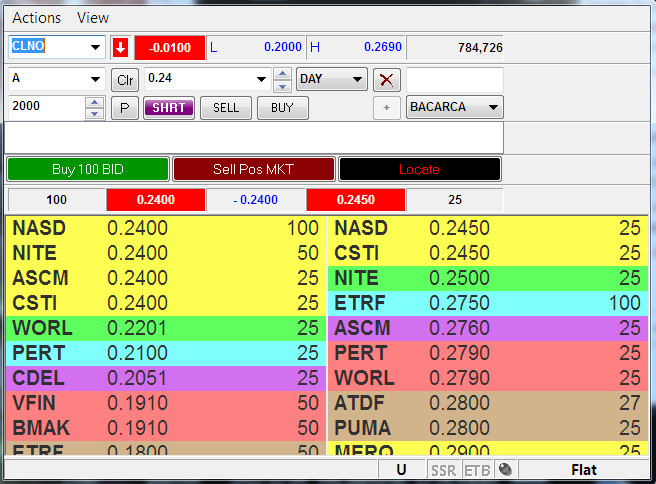
Institutional Investors, Hedge Funds or Moneyed Traders ask help to their Block Houses. They know that the Block House will manage their investments in the best way to get the best deals. The Investor asks for an entry price. But the Block House can make a deal for better entries with the Investors and with the brokers.
The Block House makes deals with brokers that are specific for the marketplace.
The Block House splits the Block Order is smaller blocks to trade with different brokers.
The splitting in chunks lets manage the trading of a lot of securities. It could be difficult or impossible to trade a big number of Securities with only one broker. It is so because of the regulations and the broker limits. Besides, smaller blocks keep a low volatility.
For short trades, the difficulty is bigger because the shares to short are fewer. Then, it is necessary to borrow them at the right time. This happens although big investors and their Block Houses have special privileges.
Expensive Execution Costs of the Block Trade
There is a particular problem in this process. It is how much a trade costs. The splitting of a Block Order in Block Trades can become expensive. The brokers charge a cost per trade and they can have different commissions. Then, a bulk of trades has an executions cost that depends on the number of trades to open.
This means that for Block Orders in a marketplace, the Block House has to limit the number or trades. In the same way, it has to limit the number of brokers and trading routes to execute the Block Trades.
Supply and Demand Disparity by the Block Trade
Get or Liquidate a big number of Securities causes strong Imbalances in the market. These actions affect the Supply and Demand willing around the Price in the market.
The Block House works to manage and cut the effect on the market of the Supply and Demand Disparity.
The necessity to contain the volatility by the Block House could sound strange. Indeed, it is very strange that Market Makers need to contain the volatility that they can cause. But there is a specific reason for this.
Very Strong Supply and Demand Imbalances cause too much volatility.
Any Market Maker, like a Hedge Fund, defines a Safety Target Price. This price is a safeguard for the interests of investors. A Hedge Fund can earn a lot of money, taking acceptable risks. It doesn’t need to charge the fund with the most of the unnecessary risks. The safeguard price is a good average price that the current market can reach. The Block House avoid that the Imbalance pushes the price away from the safety target.
The Wyckoff Trading Method, with the Trading Volume, exploits the Supply Demand Disparity. Besides, it shows the effect of Block Trades that the Block Houses execute in a Time Interval. So, in a Price Consolidation, the Wyckoff Trading Method shows how the Block Trades affect the market.
When the Block House executes a Large Block Order, it gives a direction to the price behavior.
So, the price can rise or drop marking a trend. This favors the trading of the retail traders. Indeed, the retailers can run for low-risk trades looking for the Institutional Investors Orders.
The Theory of the Composite Man to explain How the price moves
According to Wyckoff Stock Market Institute, Richard Demille Wyckoff was a Trading Authority. He was born 1873 and he was a trader and educator in stock, commodity and bond markets.
As a Stock Market Authority, he documented his work. In this way, he defined the Wyckoff method of trading and investing in stocks.
The Wyckoff Trading Method shows the truth about trading large numbers or Securities.
Richard Wyckoff introduced the concept of the “Composite Man” or “Composite Operator”.
He wrote:
…all the fluctuations in the market and in all the various stocks should be studied as if they were the result of one man’s operations. Let us call him the Composite Man,… – Richard Wyckoff
He means that it is not relevant if what moves the market is an Institutional Investors or others. What is relevant is the impact that the trading of a large amount of Securities has in the market.
So, if you understand how the “Composite Man” moves the market you get a great advantage by low-risk trades.
The Composite Man is a tool to understand how the price moves.
How to go inside the mind of the Composite Man
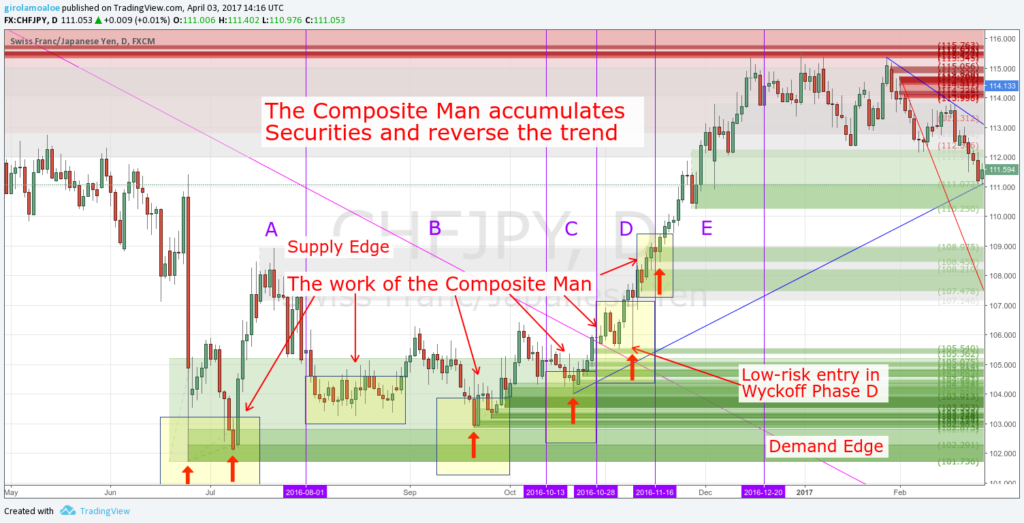
Why is so important to go inside the “mind” of the Composite Man?
The Composite Man does his Trading Job in every time and better than any other. Then, you have to learn his behaviors and his actions following what he does.
What is clear to everybody is that the market doesn’t move by itself. In the Price Consolidation, the Composite Man takes or liquids Securities in a gradual way. When this number of securities is high enough, the market runs out of the price range of uncertainty.
This means that in a Demand Level, his Trades add more Securities in his portfolio. Then, he is Accumulating Securities. Instead, in a Supply Level, his Trades cut the numbers of Securities he owns. Then, the Composite Operator is Distributing Securities to the Market.
The Composite Man represents the joint action of the Market Makers.
Studying and Practicing you get skills to see and master what moves the market. In the same way, you understand who moves the price.
In a Liquid Market like Forex, the Events in the Economic Calendar are not the cause that moves the market. Their action is very small and it doesn’t affect the market trend. Studying and Observing the Forex Market time by time, you realize that this is so.
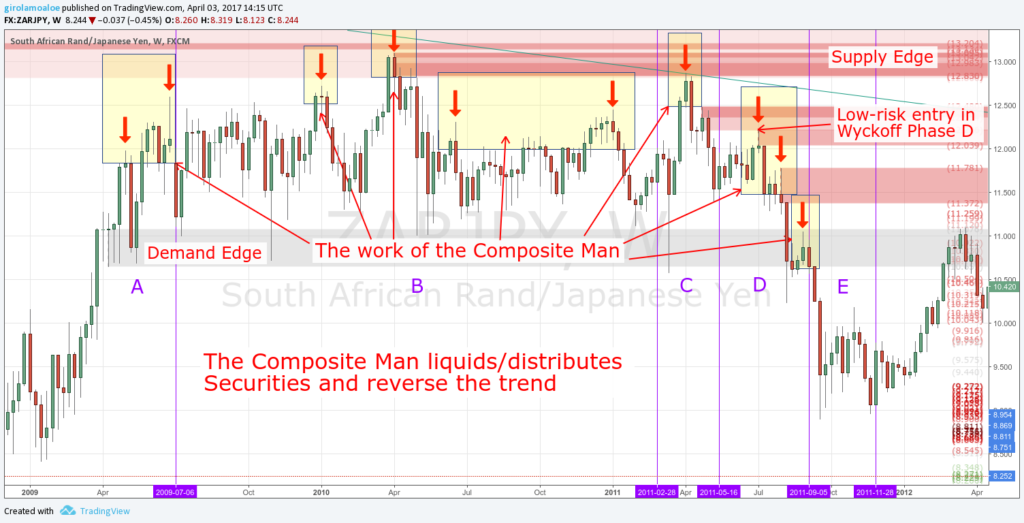
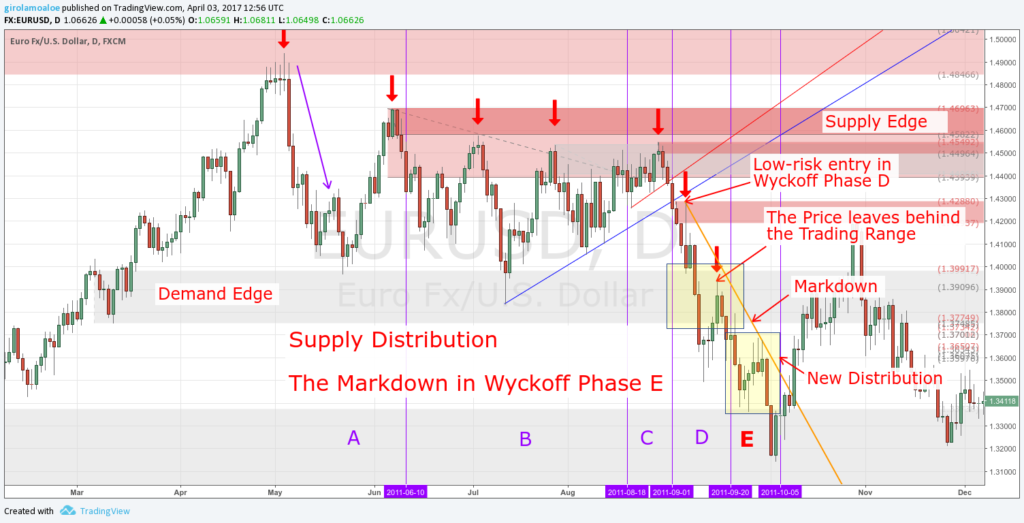
Accumulation, Distribution, and Trend, in Supply and Demand
I am a Supply and Demand Trader. A detailed analysis of the Imbalances is what rewards me day by day. My focus is on a few trades that pay well.
All this is possible studying the price action with dedication for the long-term. Everything comes from a clear comprehension of the Price Action. This puts the trader in the condition to have skills and experience to set orders days and weeks in advance.
The Wyckoff Trading Method takes into consideration even the Trading Volume.
The Trading Volume is very important on Non-Liquid Marketplaces like Low Price Stocks. Indeed, the Volume of Negotiations on Stocks is a good thing to know. It helps to make a good watch list and to understand what is going to move.
Besides, the Wyckoff strategies and techniques show the right time to open a trade. This happens according to the price behavior in a range of consolidation.
When the price action shows uncertainty, the best entry is at the origin of the new trend momentum.
It is the Imbalance that pushes the price away from the price range of uncertainty. It could not be the last imbalance in the price range. But it is the imbalance that begins a new trend so as that spikes the price out of the uncertainty.
Wyckoff Market Cycle
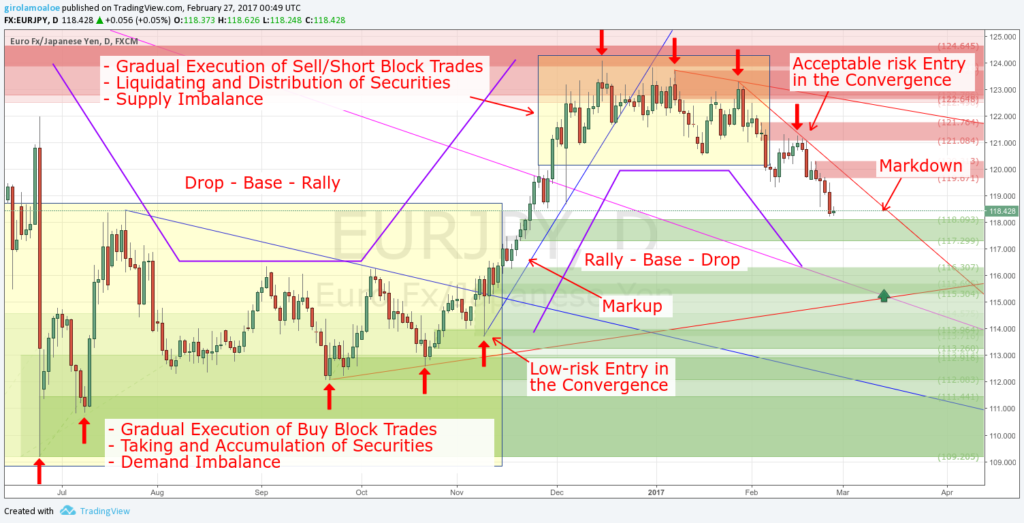
These are the famous Supply and Demand Trading Patterns for the Trend Rotation:
- Rally – Base – Drop.
- Drop – Base – Rally.
They are almost one of the first thing that every Supply and Demand Trader learns. In reality, the way which the price changes the trend shows different peculiarities.
So, these Reversal Patterns becomes very indicative. The reason is that they show the reaction at the end of the Price Progression that marks a Consolidation. But they don’t care and don’t explain the Process that change the Trend.
The Wyckoff Trading Method shows the peculiarities of the Trend Rotation.
Doing this, it gives a way to recognize the different Trading Rotation Frameworks. Besides, it shows how the Composite Man works. He Buys or Sells, accumulating or distributing securities. So, when the securities in accumulation prevail the price starts a rally in a markup. In the same way, when the securities in distribution prevail the price drops in a markdown.
The key elements of the price changing define the Wyckoff Market Cycle or Wyckoff Price Cycle.
The Market develops its trends between periods of Demand Accumulation and Supply Distribution.
In this way, you understand that there are 4 distinct phases in the price behavior.
The Wyckoff Trading Method shows these phases to define the Wyckoff Price Cycle:
- Demand Accumulation.
- Markup Trend.
- Supply Distribution.
- Markdown Trend.
Demand Accumulation and Supply Distribution in the Wyckoff Trading Method
Supply and Demand Imbalances define everything in the market. This is so because the filling of Block Orders, and then the opening of Block Trades move the price.
The Wyckoff Method of technical analysis makes clear in the chart the filling of the Block Orders. Then, you can get peaks with spikes, so as a gradual opening of Block Trades.
You see how Big Investors are gathering Securities in a Demand Accumulation. In the same way, you see where and how they are liquidating Securities in a Supply Distribution.
The Demand Accumulation and the Supply Distribution are the Supply and Demand Levels. They are Trading Ranges (or Trading Price Ranges).
So, now you understand the First and the most important of the Three Wyckoff Laws.
The Law of Supply Demand
When the demand willing exceeds the supply willing, the price rises. In the same way, when the supply willing exceeds the demand willing the price falls. Supply and Demand willing gives a direction to the market and rules the Wyckoff Market Cycle.
Persistent Level and Imbalance in Opposition
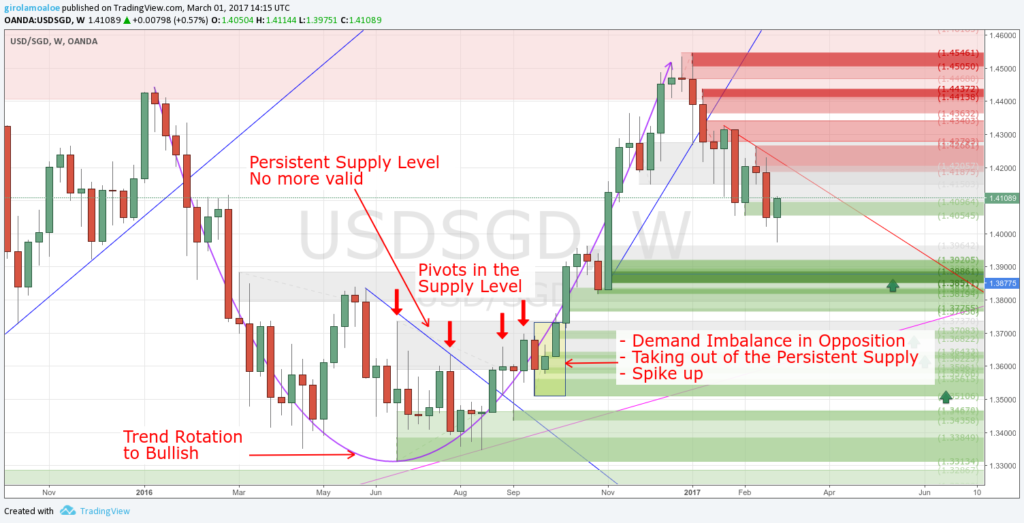
When the price takes out a Demand Level, it marks a new and fresh Supply that is good for trading. In the same way, the taking out of a Supply Level marks a new and fresh Demand Imbalance.
This kind of Supply Demand Imbalance is in Opposition to a previous price behavior.
This means that an emerging Supply and Demand Disparity is prevailing. Then, in the Price Range of a previous Imbalance, you can see the opening of new Block Trades. This increases the Disparity counter the old Imbalance into its same Price Range so as around it.
Accumulating or Distributing enough Securities the emerging Imbalance spikes the price. So, the price action takes out the old Imbalance.
When a Used Supply or Demand Level makes bounce back the price many times, it is a Persistent Level.
The strength of the Imbalance persists because there are still orders to execute. These new and old orders are still enough to give a strong opposition when the price converges.
A Persistent Supply or Demand Level is common in a Trend Rotation. The Price Consolidation shows many convergences to the same Supply or Demand Level. It is an edge of the Price Consolidation.
The taking out of a Persistent Supply or Demand Level gives a Solid Trading Opportunity. The reason is that it marks a concrete changing in the price behavior.
The new and fresh Imbalance in Opposition to the Persistent Level is a strong Imbalance.
In the most of the case, the Opposition doesn’t happen with only one imbalance. Inside and around the Price Range, the Block Trades can mark even two (or more) Imbalances in Opposition.
The Wyckoff Trading Method and Supply Demand Uncertainty
The best way to use the concept of the Composite Operator is the Analysis of the Price Range of Uncertainty.
A Price Consolidation becomes a Supply or Demand Level when the price spikes away from it. You can recognize the edges of the Consolidation that define the Price Range.
A Trading Range is a clear Price Consolidation.
This exists because the Price behavior of the previous up or down trend changes. The changing happens because the Supply Demand willing reaches an equilibrium.
The price moves around a Trading Range where the edges are Supply and Demand Imbalances.
You see them moving to a lower time frame.
Indeed, the price action marks a Supply and a Demand that trap the price in a Trading Range. Sometimes edges are clear, other times there is a pin bar with a long tale that could confuse an edge.
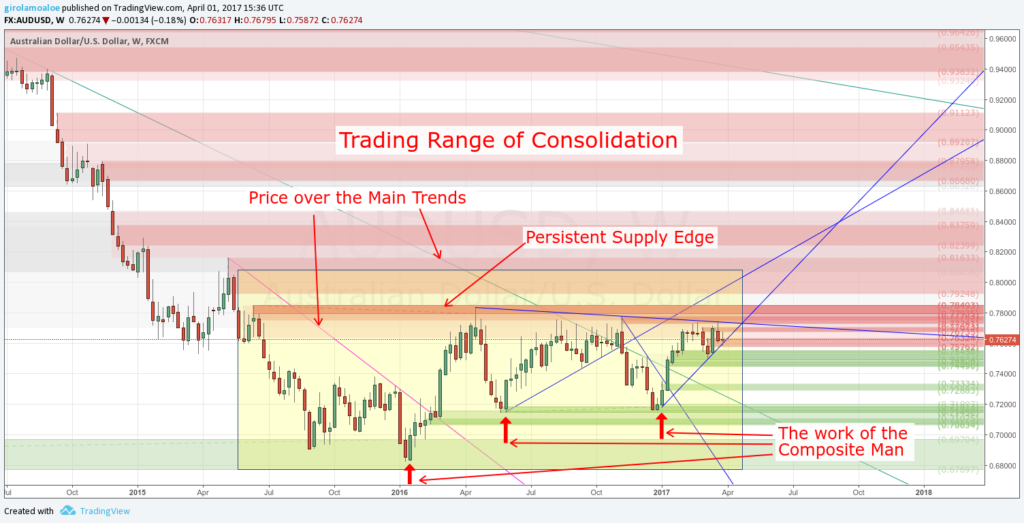
Using the Composite Man, you can investigate what happens between these edges. What you see is that the Composite Man is buying or selling. You see how and why he is taking or liquidating securities. He buys to accumulate securities so as he sells to distribute securities.
The Wyckoff Trading Method lets you expect and analyze how the price is going to run out of the uncertainty. So it can show in advance what would be the market direction out of the Trading Price Range.
According to the Richard Wyckoff Trading Method, in a Trading Range, you get Phases and Events.
They are important because they are a way to recognize a set of Rotation Frameworks. In the same way, they show where to set an order in advance.
Besides, they show why trade breakouts or breakdowns is not the right approach.
Wyckoff Phases in Demand Accumulation and Supply Distribution
The Wyckoff Trading Method becomes a priceless resource to analyze the uncertainty in a Price Consolidation.
Richard Wyckoff divides the Price Range of Consolidation is Phases. In this way, he is able to describe the work of the Composite Man in the Trading Range.
I explain this every day to the students of Profiting.Me. I show them the advantage that they get dividing the trading range into phases.
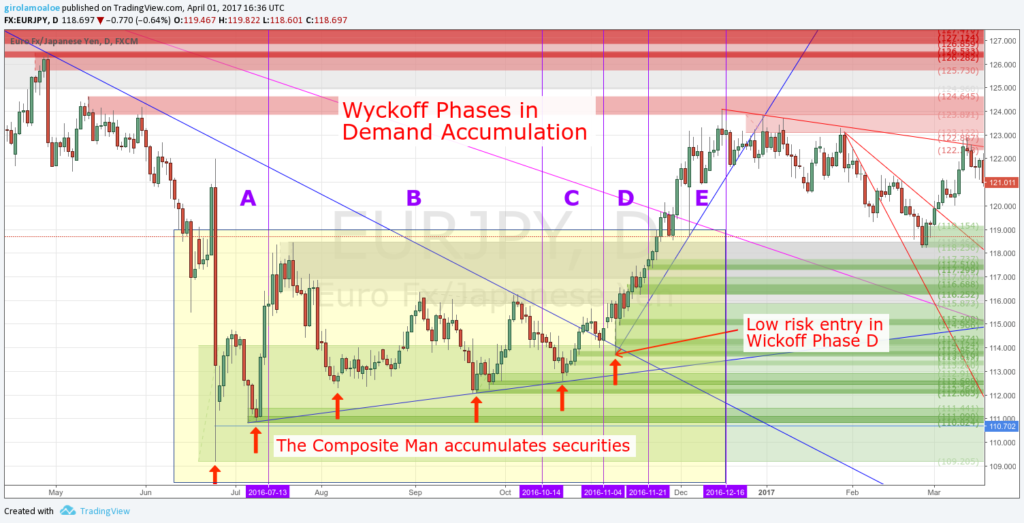
Let me introduce you the Wyckoff Phases for a Trend Rotation:
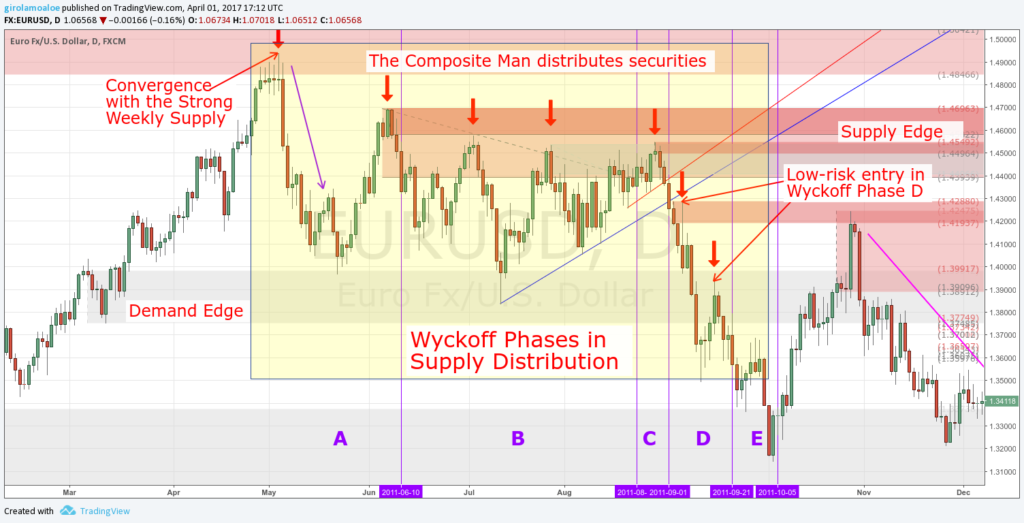
- A – Stopping of the Previous Trend.
- B – Building a Cause in preparation for a new Trend.
- C – Decisive test to understand if the market is ready to reverse the previous trend.
- D – Dominance of Block Trades to reverse the previous trend.
- E – The Effect of the Cause is the escape from the Trading Range, reversing the trend.
So, now you understand the Second of the Three Wyckoff Laws.
The Law of Cause and Effect
The Trading Range develops the cause for the Reversing of the Trend so as for the Trend Continuation. Instead, the effect is the marking of a new trend or to continue the previous trend.
The cause lets you estimate the Force of Accumulation so as the Force of Distribution in a Trading Range. Then, you realize how this Force can extend an emerging trend out of the Trading Range of Consolidation.
The Crucial Role of the Wyckoff Phase C
The Phase C shows if the market is ready to reverse the previous trend. So, the Composite Man tests the strength in opposition to the previous trend.
In a Demand Accumulation, the remaining supply willing pushes to the Buy Block Orders. This means that it tries to continue the previous bearish trend.
In the same way, in the Supply Distribution, the remaining Demand willing pushes the price up. So, it tries to overwhelm the Sell Block Orders to continue the previous bullish trend.
The Block Houses makes a decisive test to continue the trend.
If the market will continue the previous trend, you will see it in this phase. The Supply or the Demand willing would overwhelm the Block Trades in opposition. So the price could bounce back and the new Sell Block Orders will push it to continue the previous trend.
In the same way, the Wyckoff Trading Method shows in Phase C if the market can reverse the trend.
The testing of the Strength in opposition is a Convergence to a Supply or Demand level in the Trading Range. Then, the price behavior is an imbalance that pushes the price back. Besides, it is possible to get a spike back so as a pivot behind the distal line of the level.
So, these strong market reactions are a sign that the market could go to reverse the trend.
Signs of Dominance in Wyckoff Phase C
The Wyckoff Trading Method highlights some events that can occur in the Wyckoff Phase C:
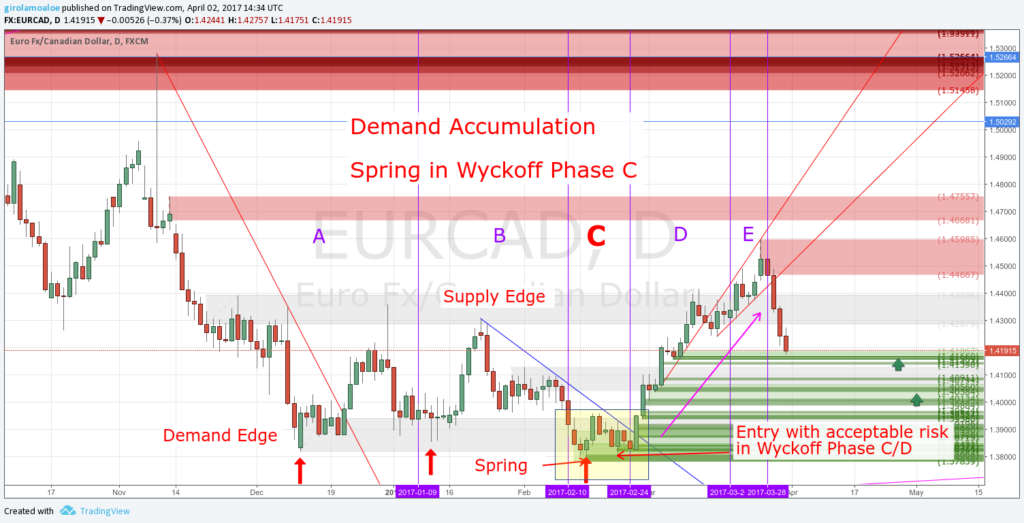
- Terminal Shakeout and Spring.
- Upthrust and Upthrust after Distribution.
Their presence is not necessary to reverse the trend. Indeed, they are not occurrences that happen in every Trading Range of Consolidation. But when they occur, they give a great advantage.
They are a Sign of Dominance for the Reversing of the Trend. Indeed, they make easier the decision to trade anticipating the new trend.
The NASDAQ definition of Shakeout says that it is a dramatic change in the market. Speculators sell their positions.

Instead, the Investopedia definition of Shakeout says that many investors exit their positions.

What they say is visible in the chart in many ways.
What is relevant is the sharp movement to and throughout one edge of the Trading Range.
In the Wyckoff Phase C, Spring and Upthrust after Distribution are a definitive test of the Strength in opposition.
As you can understand they happen late in the Price Consolidation.
Many expert traders wait to see them. The reasons are:
- Spring and Upthrust after Distribution are signs that the trend could turn in the opposite direction.
- They offer opportunities to trade catching the profitable bounce back, in the middle of the Trading Range of Consolidation.
1 – Terminal Shakeout – Spring in Wyckoff Phase C
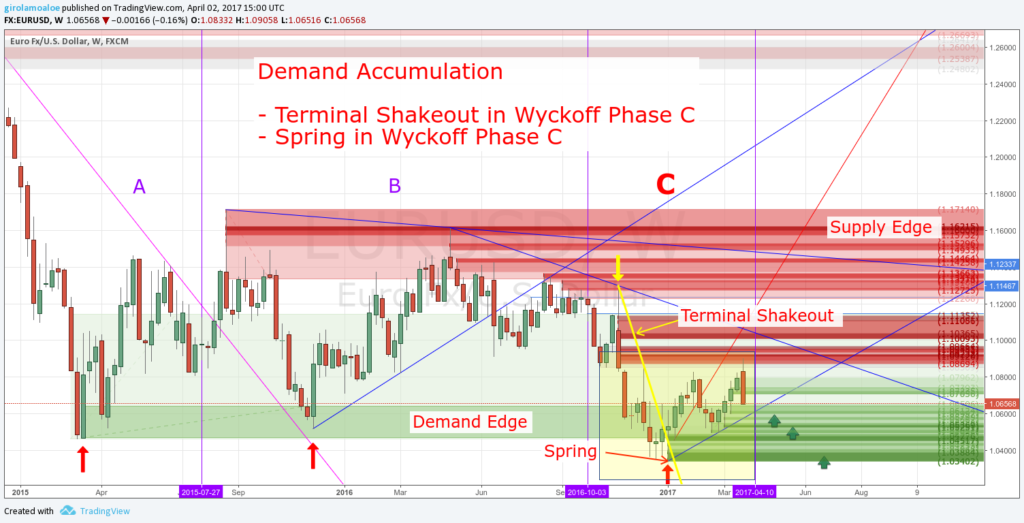
In a Demand Accumulation, a Terminal Shakeout is a rapid depreciation. It makes converge the price to the Bottom Demand Edge of the Trading Range. As a definitive test of the Supply willing, it happens to prepare the market for the markup.
The Spring takes the price behind the distal line of the Demand Edge and reverses its behavior.
This means that the price marks a Low Pivot behind the distal line. Then it pushes the price inside the Trading Range. This can happen either by a gradual recovery or by a rapid recovery of the price.
The Terminal Shakeout makes hit the stop of the buy trades. This affects more the public action and then the retail traders. So, they have to disengage their securities favoring the big investors to take them.
It puts the Large Interests in the condition to accumulate securities at a cheaper price.
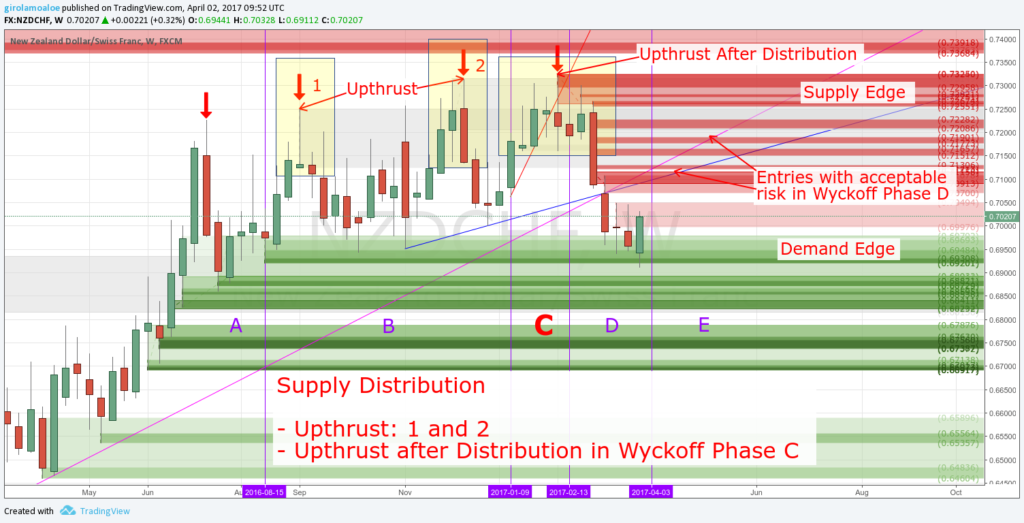
2 – Upthrust – Upthrust After Distribution in Wyckoff Phase C
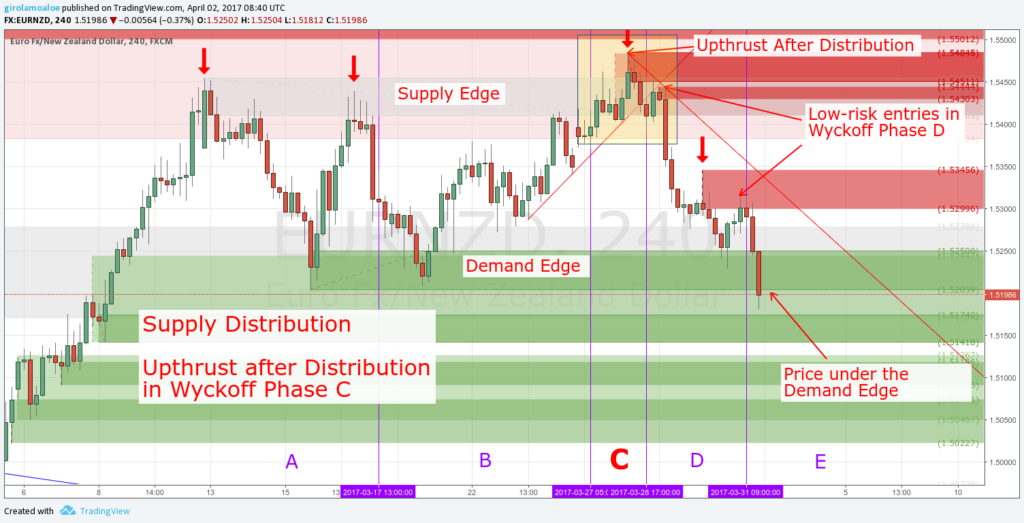
In a Supply Distribution, an Upthrust is a clear rising of the price. It makes converge the price to the Supply Edge of the Trading Range. As a definitive test of the Demand willing, it happens to prepare the market for the markdown.
If the price rises over the Supply Distribution it marks a High Pivot behind the distal line.
The Upthrust After Distribution takes the price behind the Distal Line of the Supply Edge and reverses its behavior.
Then, it pushes the price back into the Trading Range by a gradual recovery or by a rapid recovery.
This gives a false breakout and makes hit the stop to the Sell trades and Short trades. This affects more the public action and then the retail traders that take wrong trades. So, this favors the Big Investors to take advantage of the higher price before the drop.
Some considerations about Wyckoff Phase C
1 – False Breakout and False Breakdown
The Spring is False Breakdown so as the Upthrust After Distribution is a False Breakout.
Indeed the Spring is a Bear Trap and the Upthrust After Distribution is a Bull Trap.
This means that there are retail traders that Buy on the breakout or sell on the breakdown. They lose money because they think that the momentum is persisting in a direction. So they Buy high on a high pivot and sell low on a low pivot, both behind the distal line.
2 – Buy on Spring, Sell or Short on Upthrust After Distribution
Be aware, that the Wyckoff Phase C is in the middle of the Trading Range of Consolidation. It is not reversing the trend. But it shows to you if the price is ready to reverse the trend or not.
When a Spring or an Upthrust After Distribution occurs Traders could open a trade. This is the consideration that traders do. They expect that the Composite Man pushes the price back into the Trading Range.
The Wyckoff Trading Method shows this advantage and it can pay very well. But the market reaction after the pivot behind the distal line could not be a strong and large bounce back. The reason is that the orders in opposition could stop the bounce several times. This gives a choppy price action. So, many times it is better to wait for the lower risk entries in the Wyckoff Phase D.
3 – Spring and Upthrust After Distribution are not necessary
As I told, it is not necessary to have a Spring or an Upthrust After Distribution to reverse the trend.
Many times the remaining Demand willing or Supply willing is not enough. So the price could not mark a pivot behind the distal line. The decisive test could make converge the price to an edge of the Trading Range and bounce back. In other cases, the action could be too weak to reach the top supply or the bottom demand.
In these situations, the price stays inside the Trading Range of Consolidation.
4 – The Volume of the Trading Negotiations
The Trading Volume can show how the work of the Composite Man is affecting the market.
In the Wyckoff Trading Method, the Trading Volume can become a big help when you to take a trading decision.
The Trading Volume suggests how to trade the Spring or the Terminal Shakeout. In the same way, it can show how to trade an Upthrust and the Upthrust After Distribution.
For example, you can experience an increase of the volume with the rising or the falling of the price. Later, you can see a slowing of the price rising or falling still having a high volume.
The price progression slows even if the volume is still high because it is going to get a balance. Or better the Supply willing or the Demand willing is getting a strong opposition. There is an increase of the negotiations in opposition to the trend.
This is a sign of a tiring trend and you could expect a price correction so as a consolidation.
So, now you understand the Third of the Three Wyckoff Laws.
The Law of Effort versus Result
The Changing in the Volume Negotiations is the Effort and the Price Changing is the Result. The Effort causes a Result and it is proportional with the Effort. If the Effort and the Result are opposite you could expect a changing of the trend.
Low-Risk Entries in Wyckoff Phase A and Wyckoff Phase D
The Wyckoff Trading Method shows you how to trade in the best way the Trading Range of Consolidation.
This is possible because the Trading Range has several important peculiarities.
Indeed, the Wyckoff Trading Method let you see where are the low-risk opportunities. In the same way, you see where the risk of investment is instead very high. Indeed, you want to trade where the risk is the lowest possible and not where the risk is the highest.
In the Wyckoff Phase C, I showed you some crucial signs that let you understand the reversing of the trend. They are fundamental because they can give you an acceptable risk for a trade in Phase D.
But the Trading Range has a beginning and an ending. The beginning is the Wyckoff Phase A. The ending of the consolidation is the Wyckoff Phase E.
In the Wyckoff Phase D, you can set your orders anticipating the reversing of the trend.
It shows also how the price reacts to take out a Supply or Demand Edge of the Trading Range.
So, you understand now where you get the lowest risk entries for your orders in the Trading Range. Besides, you even have clear why they are in the Wyckoff Phase A and in the Wyckoff Phase D.
Stop of the Previous Trend in Wyckoff Phase A
The Wyckoff Phase A is where the Trading Range of Consolidation begins.
The Supply and Demand willing stops the previous trend and it marks the first edges of the Trading Range.
The stopping of the previous trend can happen with 2 specific Steps:
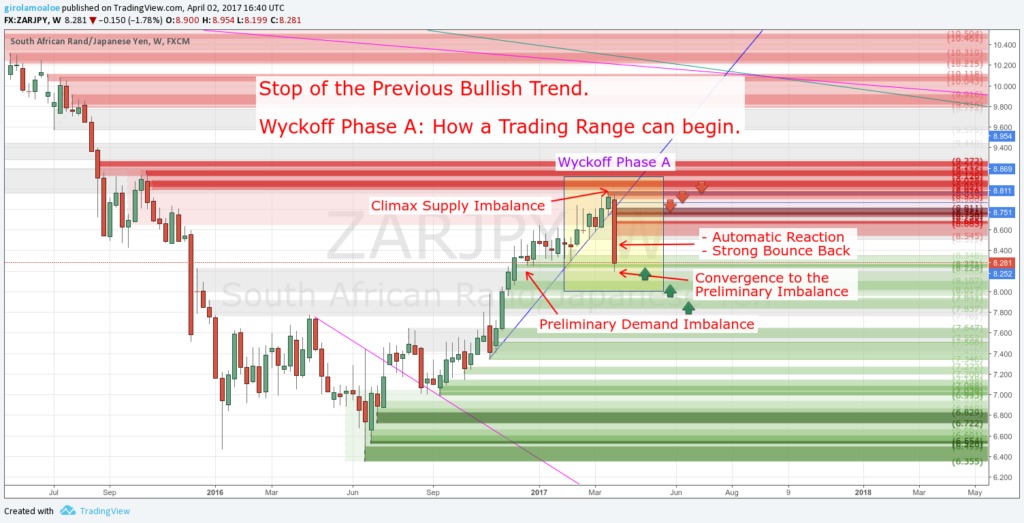
- Before to reach the reversal point, the price marks a Preliminary Imbalance to continue the trend.
- Later, the price converges to a strong level in opposition or mark the reversal point by a new imbalance. From this Climax Imbalance, it bounces back.
The Preliminary Imbalance gives the first opposition to the trend.
This becomes a reference point in the Price Action. The Block Trades opened in opposition increase the Volume of Negotiation. But these trades are not enough to stop the trend. So, later the trend continues.
A Climax Imbalance is where the large interests stop the trend.
The price progression speeds up going far away from the Preliminary Imbalance. Later, new Block Trades in opposition are enough to stop the trend. This increases the Volume again. This Imbalance could be new or the result a convergence to an old Supply or Demand Level.
The Climax Imbalance has a High Relative Strength. The prevailing of the opposite Block Trades generate an Automatic Reaction. In the Wyckoff Trading Method, this Automatic Reaction is a consistent bounce back.
How to Earn by the Automatic Reaction in Wyckoff Phase A
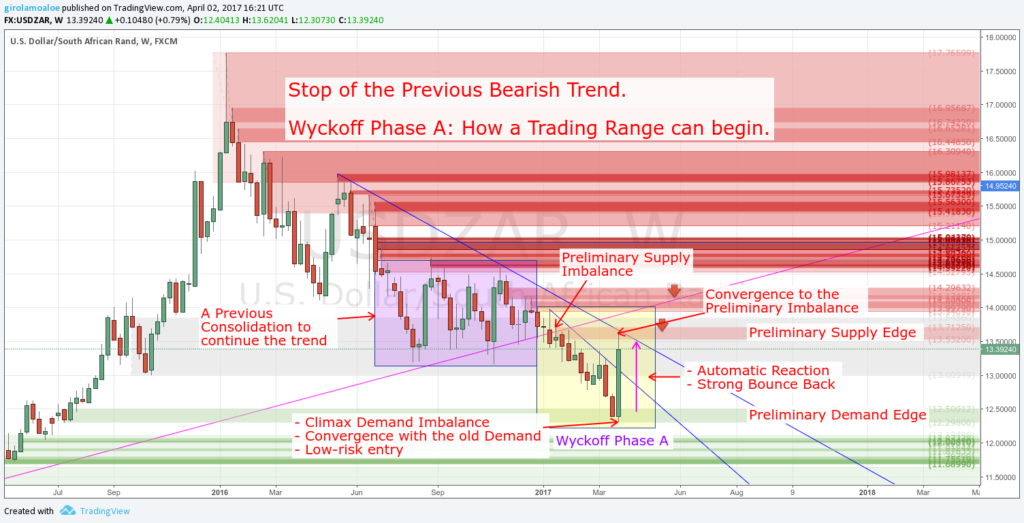
The Automatic Reaction could be immediate (or almost) giving a strong momentum. The large bounce back could be so strong to reach the price range around the Preliminary Imbalance.
Later, the price turns back to approach again the Strong Imbalance. This happens also showing a decreasing of the trading volume.
Besides, this price progression, up and down from the stopping of the previous trend, defines the Trading Range. They are the Preliminary Edges of the Trading Range.
Later, in the Wyckoff Phase B, these Preliminary Edges could get a further changing. This happens by a new High Pivot and a new Low Pivot. They mark new imbalances for a new Supply Edge and a new Demand Edge.
The Price Action in the Wyckoff Phase A is very easy to recognize. The Composite Man begins to accumulate securities or to distribute securities. Indeed, the Wyckoff Phase A is the beginning of a Demand Accumulation. In the same way, it is the beginning of a Supply Distribution.
Usually, the Wyckoff Phase A is a very profitable Price Correction. This can precede the breaking of the previous trend. Then, you get a profitable opportunity by the convergence to an old Supply or Demand Level.
The Block Trades generate the Automatic Reaction, by the convergence. From this Climax Imbalance, the price spikes with a strong momentum to the next opposition. So if you set your order in the convergence you earn a lot of money running the spike.
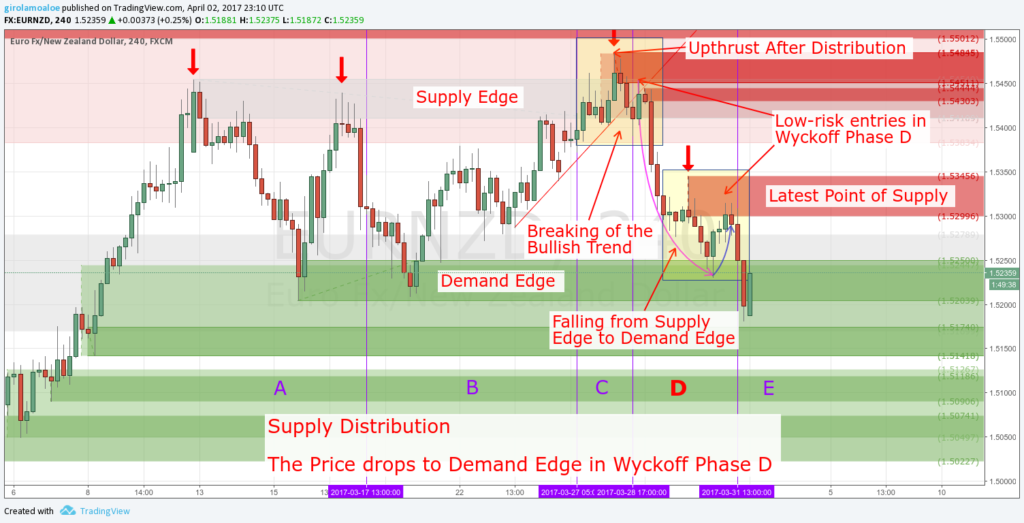
Reversing the Trend in Wyckoff Phase D
The Wyckoff Phases simplify the work and show several reference points. With the Wyckoff Trading Method, you can trade anticipating the new trend.
The Wyckoff Phase D is where the price goes to begin the new trend.
The Composite Man has already done the most of the work in the previous Wyckoff Phases. The remaining supply or demand willing in the Wyckoff Phase C made a test to continue the previous trend. But, the opposite Block Trades prevailed by the accumulation or distribution of securities. So, they pushed the price back into the Trading Range.
The momentum that arrives from the Wyckoff Phase C is ready to push throughout the Trading Range. So, in the Wyckoff Phase D, the price moves to the other edge of the Trading Range.
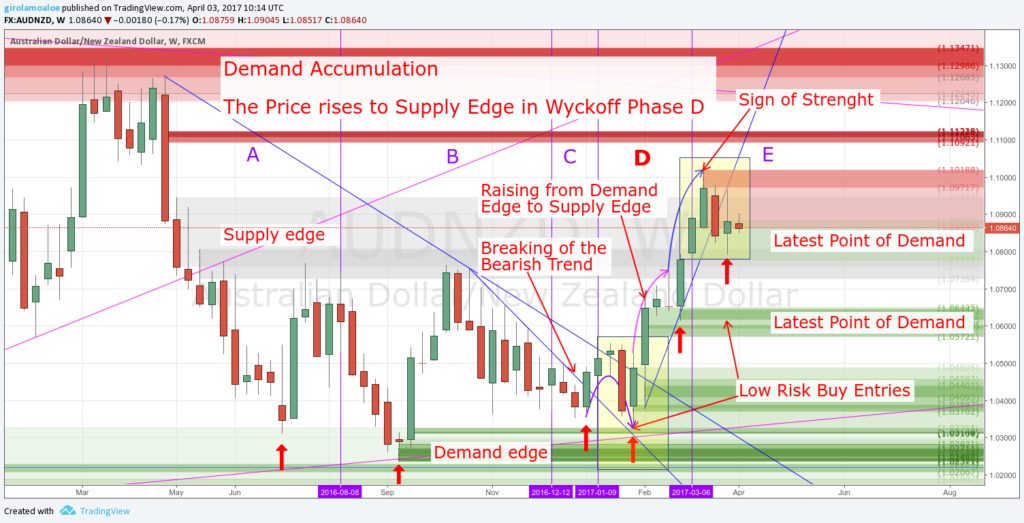
To make this, the price action marks some peaks that keep up the momentum in a direction. These are Points of Supply or Points of Demand in Wyckoff Phase D. The first of them offer the possibility to buy low or sell high inside the consolidation range.
When the price reaches the other edge, it is almost ready to go outside of the Trading Range.
The price can mark a High Pivot or a Low Pivot behind the Distal Line of the Edge reached. This can happen showing also an increase in the Trading Volume.
It is a Sign of Strength in a Demand Accumulation. In the same way, It is a Sign of Weakness in a Supply Distribution.
The price could not go outside the Trading Range with an immediate action. It begins a range of uncertainty between the Latest Point of Supply or Demand and the Low or High Pivot.
How to Earn Anticipating the Reversing of the Trend in Wyckoff Phase D
In the Wyckoff Phase B and Wyckoff Phase C, the Operators push the price to a Supply or Demand Edge. The purpose is to continue the previous trend. Of course, at least one of the Edges of the Trading Range is a Persistent Level.
Every new test of a Persistent Level pushes the price back in a new weaker swing. This marks a chain of Higher Lows so as a Chain of Lower Highs, inside the Trading Range.
In the Wyckoff Phase C, the Composite Man marks a Spring or an Upthrust after Distribution. The strong imbalance pushes the price back. This could break the Pivots Chain in the Trading Range moving the price to the Wyckoff Phase D.
The breaking of every Pivots Chain marks a new and fresh imbalance. In the Wyckoff Trading Method, this offers a first trading opportunity. The price retraces back to the broken Pivots Chain and converges to the new and fresh imbalance.
In this way, you can open a trade in the Trading Range anticipating the reversing of the trend. Indeed, you Buy low in the Demand Accumulation by the throwback. In the same way, you Sell high in the Supply Distribution.
In these cases, the risk per trade is the lowest that the Trading Range can offer.
This first peak keeps up the momentum to carry the price to the other edge of the Trading Range.
Running throughout the Trading Range, the price action will mark other entry points. This gives you the possibility to add more to your trade, before of the Wyckoff Phase E.
Setting your orders to trade anticipating the reversing of the trend, you understand the Power of the Wyckoff Trading Method.
Cause and Effect in Wyckoff Phase B and Wyckoff Phase E
I already mentioned the Second Law of Wyckoff: The Law of Cause and Effect.
All the Trading Range of Consolidation is a process that Build, Develop and Increase a Cause. This will give an Effect at the end of Consolidation.
The Wyckoff Phase C gives important reference points for your trading. Instead, in the Wyckoff Phase D, you set your orders to trade anticipating the trend.
So, if you make the right analyze, the Effect in the Wyckoff Phase E gives you a large profit.
Building a Cause in Wyckoff Phase B
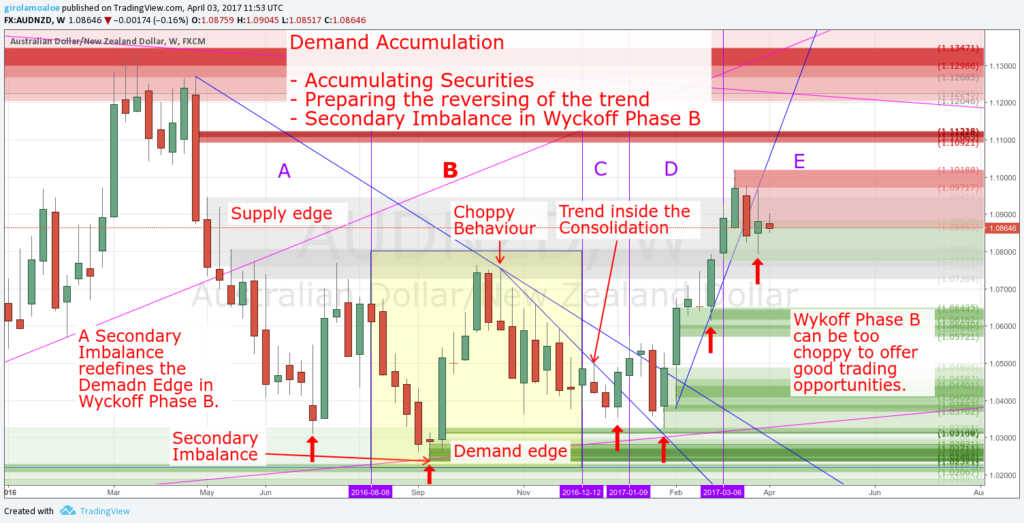
The Wyckoff Phase B shows some specific features:
- The price tends to have a choppy behavior.
- The remaining Supply or Demand willing is still consistent to continue the trend.
- It can change the Preliminary Edges of the Trading Range.
- The Composite Man increases his exposure building a cause.
In the most of the cases, the Wyckoff Phase B is not good for trading, because the chart is choppy. You see the securities accumulation so as the securities distribution. This is visible by the floating of the chart.
The large interests have a Specific Goal:
- In a Supply Distribution, it is to exhaust as much as possible the remaining demand willing.
- In a Demand Accumulation, it is to take as much as possible of the remaining supply willing.
They accumulate or distribute as much they can and this can take a long time. Indeed, the Wyckoff Phase B is the longest phase in the Wyckoff Trading Method. They do this preparing and anticipating the markup or the markdown.
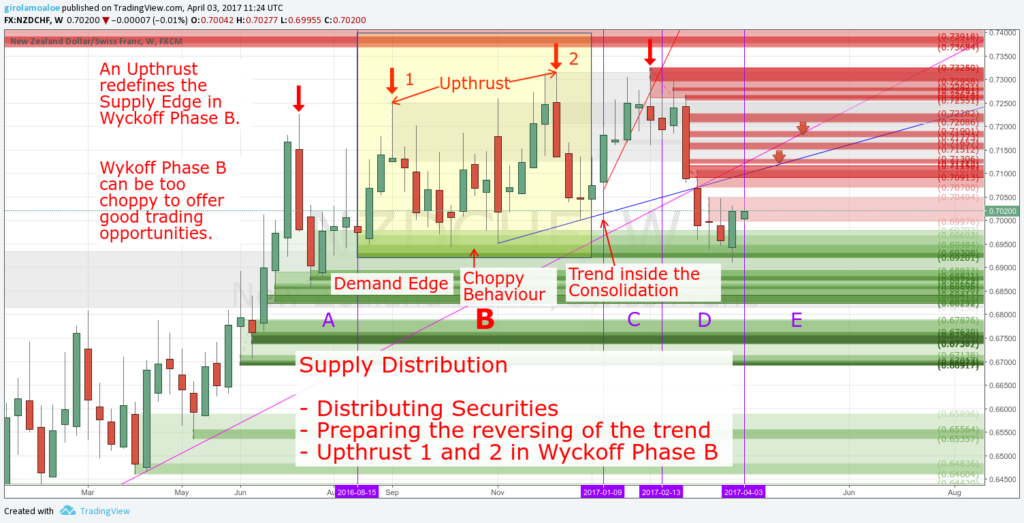
The price behavior can mark high pivots so as low pivots. Indeed, the Wyckoff Trading Method considers Upthrusts and the Secondary Imbalances. Some of them happen behind the distal line of the Preliminary Edges. They are Signals of Strength so as Signals of Weakness. So, they mark a new Supply edge so as a new Demand edge of the Trading Range.
What you see is that the price action marks and tests demand and supply levels. Besides, in a Trend Rotation, you see an edge of the Trading Range that becomes a Persistent Level.
Getting the Effect in Wyckoff Phase E
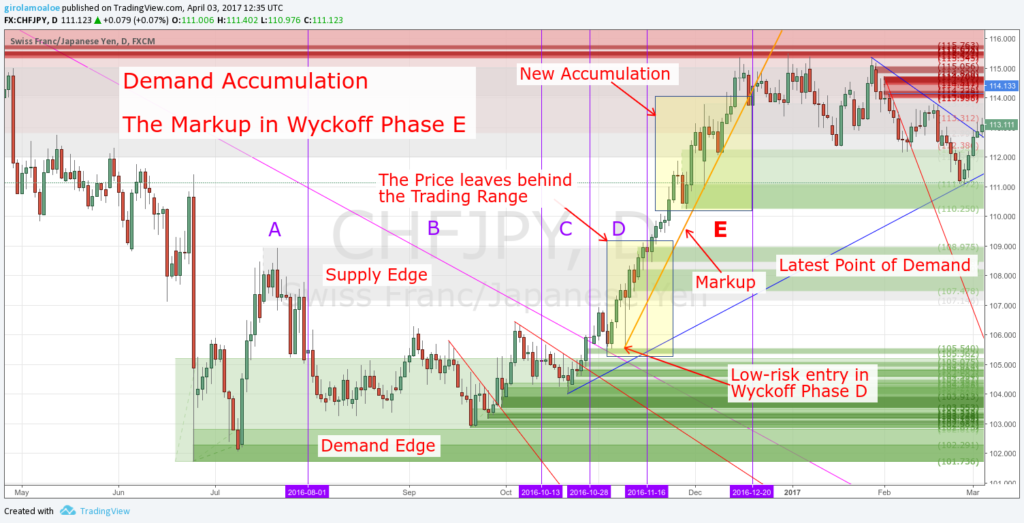
The Trading Range of Consolidation finishes with the Wyckoff Phase E. It is the Effect of accumulation or distribution in the Trading Range.
In Wyckoff Trading Method, Signs of Strength so as Signs of Weakness in Wyckoff Phase D, are the last step.
They show the Block Houses that accumulate or distribute more securities. This happens before to leave behind the Trading Range of Consolidation.
The rising or the drop makes clear the new trend by a Markup or a Markdown.
So, the Trading Range becomes a Demand Accumulation or a Supply Distribution. The Demand willing prevails and then the price rises in a Markup. So as the Supply willing prevails and then the price drops in a Markdown.
Any new trend is not linear, the price rises or drop marking steps.
Every step exists because a new imbalance keeps up the trend momentum.
So, new Block Trades take or release more Securities on the way to reach the next trend rotation.
You understand that any relevant price correction could be an opportunity to trade, accepting the risk. This means that you set an order to follow the trend. The reason is that any price correction marks a new Supply or Demand Level.
The price can even show an acceleration in its progression. Then, the price goes far away from the trend by a relevant momentum. In this case, the bounce back would be an Automatic Reaction to begin a new Consolidation.
The bounce back can happen in 2 ways:
- By a convergence to a Supply or Demand Level in opposition.
- Marking a new imbalance before to reach a visible old and strong level.
So, the new Automatic Reaction shows the Wyckoff Phase A for a new Trading Range of Consolidation.
Conclusion
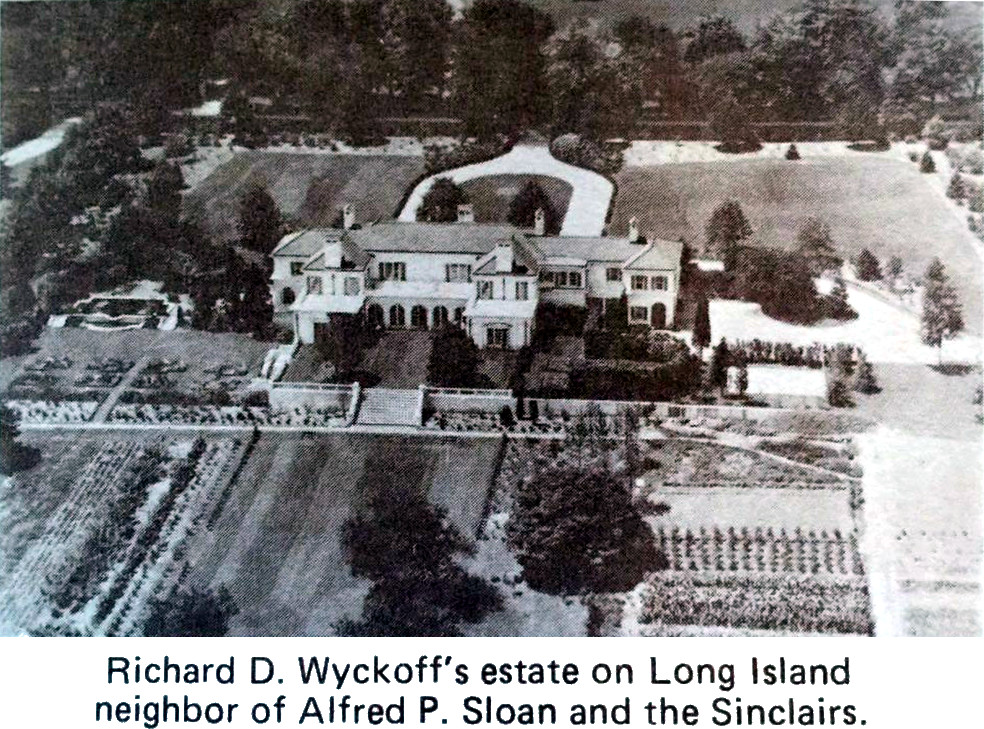
Richard Wyckoff has become so rich, to live in an estate with 9 and a half acres in long island. Becoming richer, Richard Demille Wyckoff turned his focus on Education, Teaching, and Publishing.
The Price Action is everything and the Wyckoff Trading Method shows all you need for trading. You see how your perception of trading changes when you see all the peculiarities.
The Three Wyckoff Laws are an inestimable resource for your trading:
- Law of Supply Demand.
- The Law of Cause and Effect.
- Law of Effort versus Result.
What they show you is how the market move, what is the cause and how to measure the Effect.
The Wyckoff Trading Method, since the beginning of XX century, gives an enormous help. It shows to you where and how to take your trade, anticipating the new trend. Then earning
I explain to the Profiting.Me students the importance to understand the Rotation Frameworks.
The most common Rotation Frameworks are the Parabolic Rotation and the Head Shoulders. The Trading Range of Consolidation includes and absorbs any Trading Rotation Framework.
The Rotation Frameworks at the beginning and at the ending of the Consolidation are the easiest to trade. They give the lowest risk and the most profitable opportunities. In an easy Trading Scenario, you get the Parabolic Rotation Framework in Wyckoff Phase A. Instead, you can get a Head Shoulders Framework when the price moves from Wyckoff Phase C to Wyckoff Phase D.
The Wyckoff Trading Method clarifies the Price Action in the best way. It opens your eyes to all those peculiarities that you must know to earn large profits.
So, let me ask you a question:
- What are your experiences about trading the reversing of the trend?

Chris Robbie says
Dear Mr. Girolamo Aloe,
Thank you for your article
You have successfully made me have a better understanding regarding Wyckoff
Frankly speaking, It’s a difficult topic to understand
You explain systematically, in a way simpler manner
Regards,
Chris
(Jakarta-INDONESIA 🇮🇩)
Girolamo Aloe says
Thank you, Chris. But be aware that this important topic is the Foundation of Trading so as the Foundation of the Market Comprehension. After this, you must study Financial Mathematics. 🙂
Dang Hung says
Best article about Wyckoff Tranding Mothod – Thank you so much. Happy Trading.
Mike says
This is one of the best article I read about the Wyckoff law. Very systematic.
James says
This is one of the most confusing articles I’ve ever read in my life.
Girolamo Aloe says
Hi. Thanks for your comment. The post is a guide. It is very long. It explains a lot of things. It is a difficult content and it is not intended to be easy.