Many people ask me How to find the right Supply and Demand in Forex? Another common question that I get is How to draw Supply and Demand Levels? Besides, a recent question that someone asked me is How to decide if a Supply or Demand Level is true? Let me answer in the right way.
I get these questions with a forceful continuity. What is not good is that people ask nothing else than this. This shows a lack of their Trading Education. That’s why I help people, sharing my Trading Experience with the Students of Profiting.Me.
I am not happy to get this kind of questions from traders. The reason is that who asks if a Level is True shows a problem. This problem doesn’t depend on Supply and Demand Trading.
Indeed, he shows that he is still not enough ready to understand the Price Action in a proper way. So he needs more practice and more study in the right way. For this purpose, I can recommend to him to join on Profiting.Me.
The Price Action shows the trading opportunities in many ways.
The training and the experience reward the trader in the right way because he understands the Price Action.
The expert Traders are able to earn a lot of money watching the chart and acting according to it.
They set their orders and wait. Later, even if some trade is wrong, the money comes because they know what to do.
The importance to Analyze the Trading Scenario
The typical problem is that people skip the process to have clear the Trading Scenario.
Intraday traders and newbies skip this process in every moment and it is a mistake.
The most of the traders give importance to the wrong things.
For example, those questions that people ask me, show:
- Newbies Traders give too much importance in the way to look for a Supply and Demand Imbalance.
- They avoid the understanding of the Price Action in the Trading Scenario.
There is no way to make a profitable trading if the Price Action around a Trading Scenario is not clear.
Supply and Demand in Forex clarify the Price Action and this is very important. But in the practice, Supply and Demand Levels are only Reference Points on Chart.
You have to understand this:
You cannot base your trading on Reversal Points without understanding what is happening.
There is no way to become rich only drawing rectangles on the chart to get Supply and Demand Imbalances.
A proper comprehension of the Price Action is the only way to earn money in a consistent and constant way. Period.
There is nothing else. If you want to earn money you must keep your focus on the Price Action.
Mistakes happen at any moment. We take wrong trades because we don’t see some relevant things in the Trading Scenario. But this doesn’t mean that we cannot be profitable month by month.
Imbalance between Supply and Demand in Forex
How to identify Supply and Demand in Forex? The answer to this question is easy because what you need is in the Price Action in a clear way.
When we look for a Supply or Demand Level, we look for a Price Action that marks a consolidation. It is a Price Range where the price can show uncertainty so as the origin of a spike. In the same way, we look for a Price Action that marks an immediate Reversal Point.
The Price Consolidation can spend some candles (one, two or more) marking edges.
Supply and Demand in Forex are easy to recognize and easy to trade. The reason is that Forex is a High Liquid Market.
There is nothing that affects a high liquid market more than the Market Makers. They change the Price Progression giving a direction to the market. Everything else is almost irrelevant.
The Catalysts from the Economic Calendar don’t chance the main trend.
The Reversal Points in the Price Action shows where Big Orders affect the market. In the Trading Scenario, they define the market direction.
This happens because buyers or sellers prevail giving a momentum.
A Strong Momentum so as a Weak Momentum depends on the Imbalance between the Supply and Demand.
This gives an advantage and it is enormous because you see what moves the market and why it moves. The reason is that Supply and Demand in Forex so as in any Liquid Market, determines the Price Action.
Newbie Traders fail in this. They don’t consider what moves the price. They look for a support or a resistance defining them strong or weak in a wrong way without understanding why.
Candlestick Reversal Patterns
The Imbalance between Supply and Demand in Forex shows the role of the Reversal Patterns. This is not only for the Forex Market that is the easiest market to trade. It is the same in any other marketplace, Liquid, and Not-Liquid. But any Liquid Market lets you trade in relax and in an easy way.
Supply and Demand in Forex need a clear comprehension of the Reversal Patterns.
They don’t define the imbalance, but they show how the big orders change the price direction.
Besides, they mark the price range where there are chances to get a new reversal point.
Talking about Reversal Candlestick Patterns, I have to say that it is good to recognize them. But, in practice, it is not necessary to become a specialist in Candlestick Patterns.
They are a way that let you recognize the imbalances, but almost nobody takes care of them. The reason is that you recognize the Supply and Demand Imbalance, then you understand how to trade it. But you don’t care for the most of the Reversal Candlestick Patterns you see in the chart.
I am not here to talk about Candlestick Patterns. So, I will not look on my charts for examples to show you. Instead, I am going to show you examples that come from an authority trading website.
According to what StockCharts reports, there are official Price Action Candlestick Patterns. What I mean is that everybody can describe a price behavior in the way he likes. But StockCharts shows a standard that every trader accepts. The images in this paragraph are a gentle courtesy of StockCharts.
Candlestick Bullish Reversal Patterns
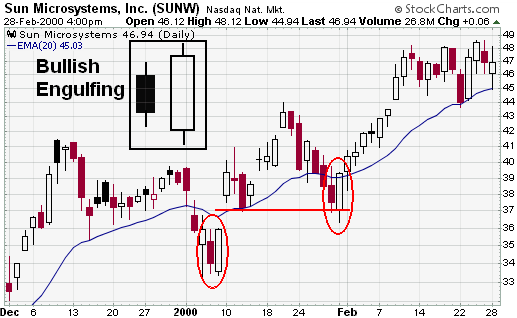
1 – Bullish Engulfing
The Bullish Engulfing is a Bullish Reversal Candlestick Pattern that shows a small bearish body and a long bullish body. The bullish body candle closes over the small bearish candle.
2 – Piercing Pattern
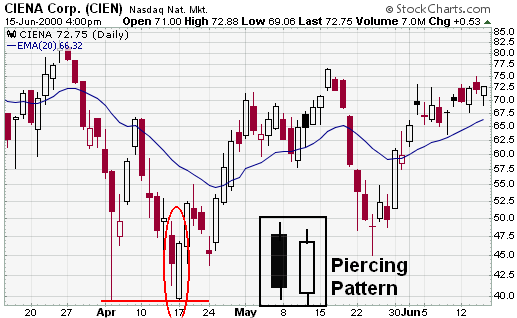
The Piercing Pattern is a Bullish Reversal Candlestick Pattern with two candles. This Bullish Candlestick Pattern shows:
- A Bearish Candle with a long body.
- A Bullish Candle that opens at a new low and closes over the first half of the previous candle.
3 – Bullish Harami
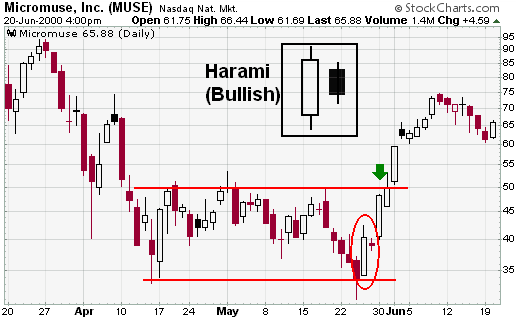
The Bullish Harami is Bullish Reversal Candlestick Pattern that shows two candles. The second candle has the body inside the price range of the previous bearish candle. This second candle is bearish or bullish and it can precede the bullish momentum.
4 – Hammer
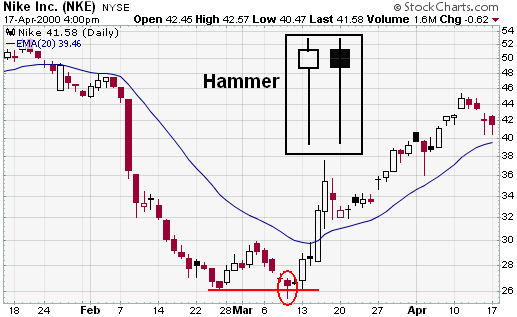
The Hammer is a Bullish Reversal Candlestick Pattern where the price drops down marking a new pivot. Later the price spikes up running in the opposite direction. This Bullish Candlestick Pattern marks a Long Tail to the candle.
5 – Morning Star
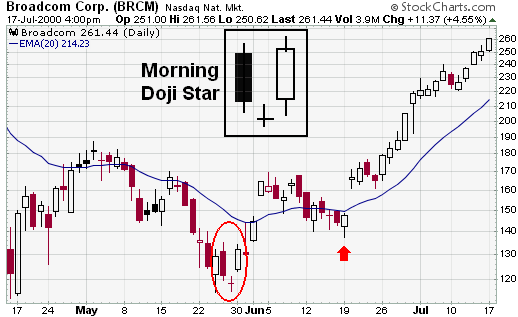
The Morning Star is a Bullish Reversal Candlestick Pattern with a reversal candle between two gaps. This Bullish Candlestick Pattern shows:
- A Bearish Candle with a long body that shows the extended drop, before the gap.
- A Bullish Candle with a long body, after the gap, that closes over the first half of the first candle.
- The Body shadow of the middle candle under the shadows of the candles at left and right.
6 – Bullish Abandoned Baby
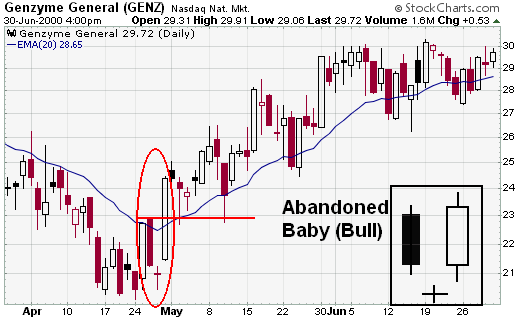
The Bullish Abandoned Baby is a Doji Candle between two gaps. This Bullish Candlestick Pattern shows:
- At left a Bearish Candle before the gap.
- At right the opposite Bullish Candle after the gap.
- Doji Shadow under the shadows of the candles at left and right.
Candlestick Bearish Reversal Patterns
1 – Bearish Abandoned Baby
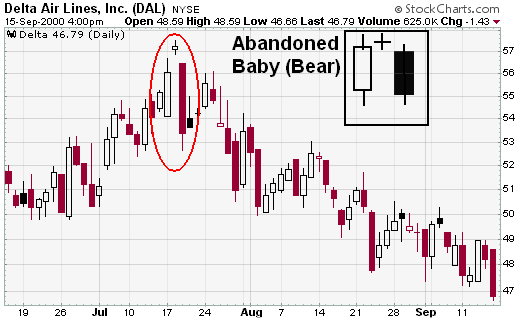
The Bearish Abandoned Baby is a Doji Candle between two gaps. This Bearish Candlestick Pattern shows:
- At left a Bullish Candle before the gap.
- At right the opposite Bearish Candle after the gap.
- Doji Shadow over the shadows of the candles at left and right.
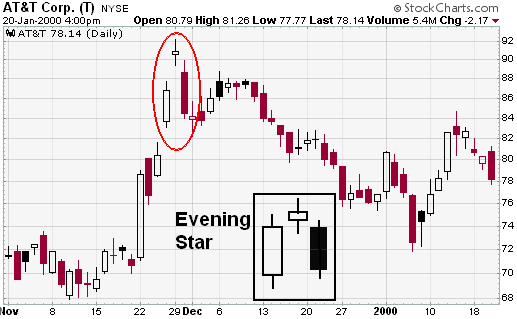
2 – Evening Star
The Evening Star is a Bearish Reversal Candlestick Pattern with a body candle between two gaps. This Bearish Candlestick Patter shows:
- At left a Bullish Body candle before the gap.
- At right the opposite Bearish Candle after the gap that closes lower than the first half of the previous candle.
- A body candle with the shadow over the shadows of the candles at left and right.
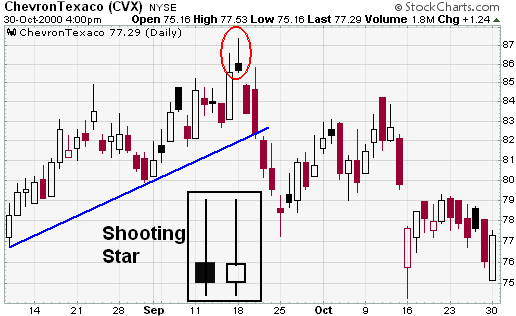
3 – Shooting Star
A Shooting Start is a Bearish Reversal Candlestick Pattern that shows a single candle. This Bearish Candlestick Pattern shows a High Pivot with a long tail. The candle body closes near its opening price.
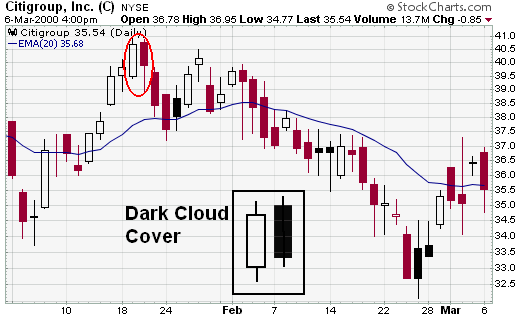
4 – Dark Cloud Cover
The Dark Cloud Cover is a Bearish Reversal Pattern where a Bearish Candle follows a Bullish Candle. The Dark Cloud Candlestick Pattern shows:
- The Bearish Candle opens with a higher price.
- The Bearish Candle closes at a price that is lower than the first half of the previous bullish candle.
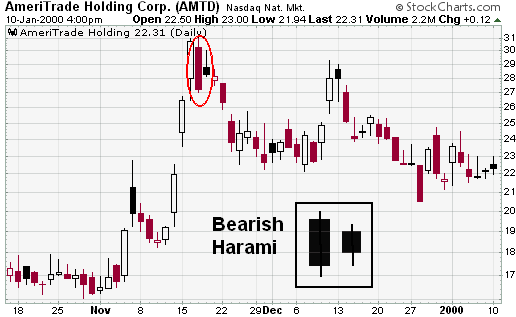
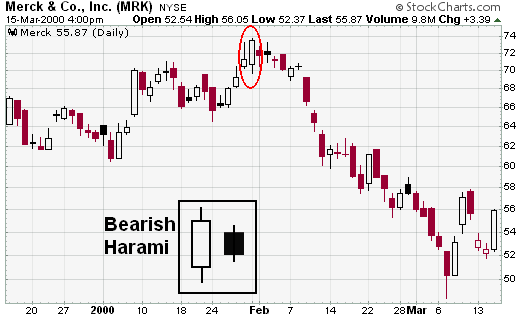
5 – Bearish Harami
The Bearish Harami is Bearish Reversal Candlestick Pattern that shows two candles. The second candle has the body contained inside the price range of the previous bullish candle. This second candle is bearish or bullish and it can precede the bearish momentum.
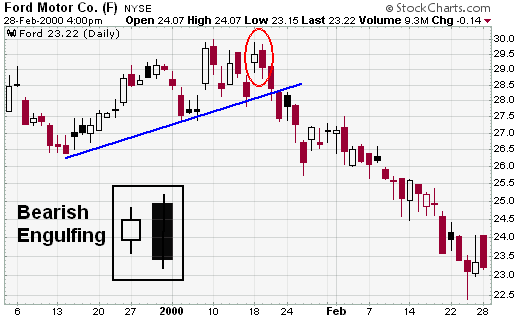
6 – Bearish Engulfing
The Bearish Engulfing is a Bearish Reversal Candlestick Pattern that shows a small Bullish Body and a long Bearish Body. The bearish body candle closes under the small bullish candle.
How the price leaves the Supply or Demand Level
Supply and Demand in Forex mark clear imbalances giving a very easy trading practice. How the price leaves the Level shows the strength of the imbalance.
The way which the price leaves the level is part of the Supply and Demand Trading Rules.
When the price changes the trend there are several considerations to do:
- Is the imbalance leaving the level after 2 candles or it spent more candles inside it?
- Has a new High Pivot or Low Pivot, behind the Distal Line, marked a Reversal Point?
- Is the Imbalance Price Range hosting several Pivots Inside the Supply or Demand Level?
- Is the price showing Uncertainty around the Proximal Line before to spike away from it?
The Imbalance between Supply and Demand willing depends on the Orders.
Large Block Orders on a specific price can oppose to the price direction.
A Reversal Point happens when the filling of Big Orders changes the price behavior.
The imbalance between the Supply and Demand in Forex can happen in many ways. The orders can push the price in the opposite direction. In the same way, the orders could be not enough to give an immediate changing of the trend. So the price begins a consolidation around a price range. Many times, the price stays trapped in a small range between a Supply and Demand Levels before to spike away.
What is relevant for trading is understand if the imbalance could be so strong to mark a new Reversal Point. In the same way, it is important to understand the uncertainty in a price consolidation.
Strong Imbalance on Supply and Demand in Forex
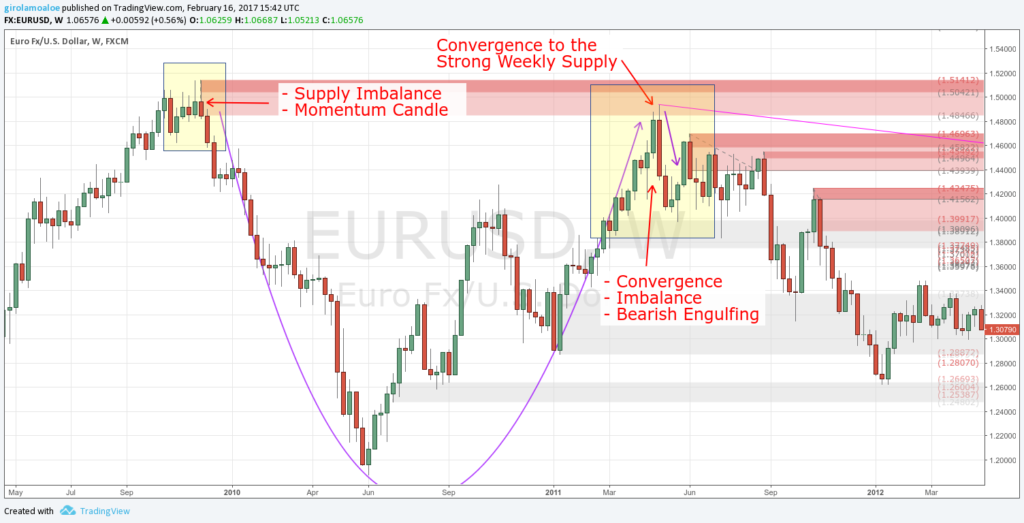
In any Supply and Demand Trading Strategy, people make the point on the strong imbalance.
When a Supply and Demand Imbalance is strong, the price spends a very short time inside a level.
This happens at the origin of the level when the price action marks a new Supply or Demand Level. Besides, it occurs when the price comes back on a Level and the orders push it in the opposite direction.
As I already said, what is relevant is how the price leaves the level.
If a level is strong it has high chances to host enough big orders for new strong imbalance. Then it has enough chances to push the price away with a Strong Momentum.
Then, a strong imbalance can have an immediate reaction pushing the price away by a Momentum Candle.
Then, the momentum candle occurs at the origin of the level. In the same way, the momentum candle can occur when the price converges to the strong Supply or Demand Level.
This means that you see a candle that shows the price moving to the level. Besides, you get another candle in opposition that shows the leaving of the level. I mean 1, 2 or even 3 candles that mark a Reversal Candlestick Pattern.
This is a favorable Price Action. But it is not enough to set a new order to the Supply or Demand level. It is only one of many reference points to use for trading.
A Strong Imbalance between Supply or Demand Level alone doesn’t guarantee Successful Trades.
Weak Imbalance and Uncertainty
In a Liquid Market, the Uncertainty doesn’t take a very long time. It limits the price progression so as it can affect the trade profitability.
Supply and Demand in Forex Trading can show many times this kind of limitation. For people who like strong terms, they could define this limitation like a Trap.
The Uncertainty happens when the price moves between a Supply and a Demand Level.
This shows a Price Range where Supply and Demand Levels are like edges and they are close to each other.
Of course, this is a general way to describe the Uncertainty in the Price Action. But it is what happens in the most of the cases.
Let me explain better:
First, the price origins or converges to a Supply or Demand Level.
Second, the imbalance shows weakness. It means that the price spends several candles inside the level.
Third, the price starts a consolidation around the Proximal Line of the Level.
The imbalance pushes the price in the opposite direction. But, that imbalance shows weakness by the impossibility to push the price far away from the level.
So, you understand an important thing:
The Price Range of Uncertainty is a Risky Trading Scenario.
In this circumstance, you don’t know where the price is going, but you know what you have to wait:
- Looking for a low-risk trade, you wait for a spike from the price range of uncertainty.
- So, you see where the new momentum begins.
- Then, you get a new imbalance that pushes the price in a direction.
Uncertainty and Pivot inside a Supply or Demand Level

When the price takes a time to leave a Supply or Demand Level, it tests that Level more times.
The same thing happens when the price is in a trap between a Supply and a Demand Level.
For example, the price converges, but the imbalance is not enough to push the price far away from the level. So the price starts a consolidation around the Proximal Line of that Level. What you see is that the price is in a trap between a Supply and a Demand.
So, the price moves inside a small range, going to test more times the Level where it had converged. Then, with every new test, the price action marks a new pivot inside the level.
What is relevant is that every new Pivot makes the Supply or Demand Level weaker, time by time.
The same thing happens in the opposite level that traps the price progression.
So, you have to wait for a new strong imbalance that pushes the price away from that uncertainty. In this way, the price action will take out one of the edges: the Supply or the Demand level.
Every Pivot inside the level is a Reversal Point. It changes the status of the Supply or Demand Level.
It gives also a way to refine better the level, reducing the price range of the original imbalance.
We don’t trade the Ranging because it carries high risk. Instead, we trade the Trending because it pays.
Besides, Supply and Demand in Forex don’t demand Catalysts. Then, to earn consistent money as a reward, you don’t need to trade the Economic Calendar Events.
Persistent Level on Supply and Demand in Forex
When we talk about Used Supply or Demand Levels, we talk about Price Ranges where the price bounces back.
So, it is a situation where the price converges and the orders push it back. When this happens one time and more, the Imbalance in Supply and Demand in Forex consumes orders. This decreases the strength of the Supply or Demand Level.
Every Pivot inside the Level is like a new “edge”. The price range from the Proximal Line to the Pivot becomes weaker.
Besides, the risk becomes higher than that in the price range from the Pivot to the Distal Line.
So, the price range from the Deepest Pivot to the Distal Line could give a stronger opposition.
Indeed, in any Forex Supply and Demand Strategy, the role of a Persistent Level is relevant.
In any Supply and Demand Trading Method, every Used Supply or Demand Level is not good for low-risk trading opportunities. At least, until the Level needs a refining in a proper way, to show the lowest risk opportunities.
A Persistent Supply or Demand Level can “persist” for the long-term.
Then, the Level pushes back the price time by time, until the orders will be all absorbed.
When the Price takes out a Persistent Supply or Demand Level, it marks Strong Imbalances.
The new Imbalances are in opposition to the Persistent Level, inside and around its Price Range.
So, the Price Range of the Persistent Level can host now a set of low-risk trading opportunities. These opportunities have different risk degrees and some of them can offer an acceptable risk on investment.
Persistent Supply or Demand Level in a Trend Rotation
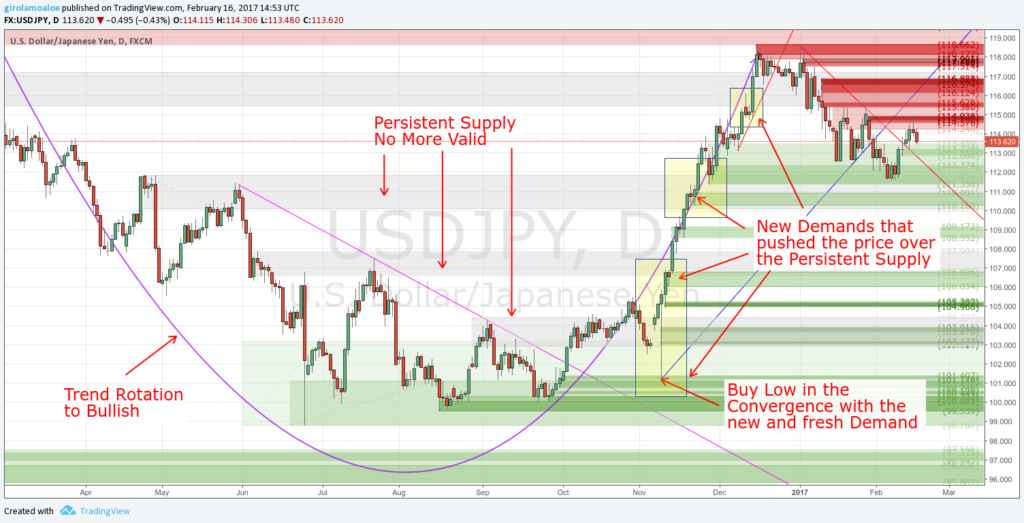
Supply and Demand Imbalances that are Persistent Levels give important advantages. These are visible and usable in an easy way Trading Supply and Demand in Forex.
- Are you sure to know what happens in a Trend Rotation?
- Did you even think about the peculiarities that the Price Action shows in specific Price Consolidations?
A Trend Rotation is a Price Consolidation. It marks specific Reference Points that show how the Trend is Changing.
A Persistent Supply or Demand Level is one of these Reference Points.
The Persistent Level opposes the Changing of Trend.
It makes bounce the price back time by time.
When the Price Action favors a Rotation to Bearish it marks High Pivots.
In the same way, in a Rotation to Bullish, the Price Behaviour marks Low Pivots.
What you see is that the trend rotation follows a Pattern or a Rotation Framework. I don’t care about the Pattern, but I care so much about the Rotation Framework.
Every Trend Rotation marks Steps of a Rotation Framework.
Every step is a trading opportunity and it is a new Supply or Demand Imbalance. Then every step is a relevant Pivot in the price consolidation.
In a Trend Rotation, the price marks new strong Supply or Demand Imbalances. They push the price to the Persistent Level.
The Price converges to the Persistent Level time by time. When the level will be enough weak and the momentum strong the price will spike behind the Distal Line.
Persistent Level No more valid and Imbalances in Opposition
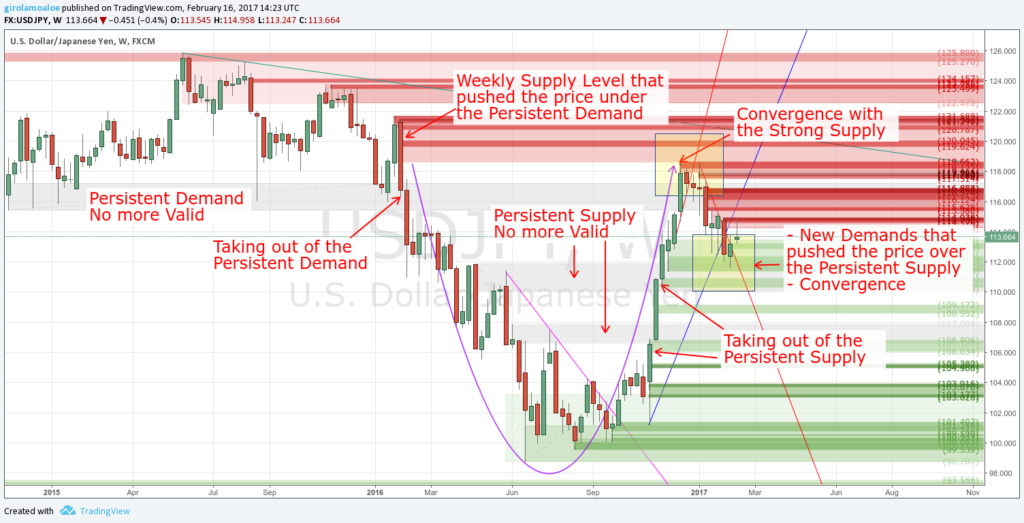
What newbies name like Strong Support or Strong Resistant is instead a Persistent Level. It has an Origin by the Initial Imbalance so as it can show other imbalances inside it by the convergences. Besides, it can persist for a long-term so as the new Pivots inside it can redefine its price range.
- What happens when such Supply or Demand Level in Forex (then where there is high liquidity) is no more valid?
- What happens when the price takes out the Persistent Supply or Demand Level?
Unlike other used Supply and Demand Levels, the taking out of a Persistent Level makes everything different.
When the price is behind the Distal Line of a Persistent Level the Trading Scenario changes.
So, you see a real changing in the price action that gives new Trading Opportunities.
To make this, the Persistent Level becomes weaker by convergences. Besides, the taking out of the Level needs of new Supply or Demand Levels in Opposition.
The taking out of the Persistent Level leaves a Price Range that becomes a solid Reference Point.
The Price Action marks new opposite Imbalances around the Price Range of the Persistent Level that is no more valid.
It hosts New Supply or Demand Imbalances that offer new Trading Opportunities in Opposition.
So, if the Price takes out a Persistent Supply Level, there are new Demands around and inside the Level. The new Demands are going to offer new Trading opportunities with different risk degrees.
Breakout Trap and Breakdown Trap in a Persistent Level
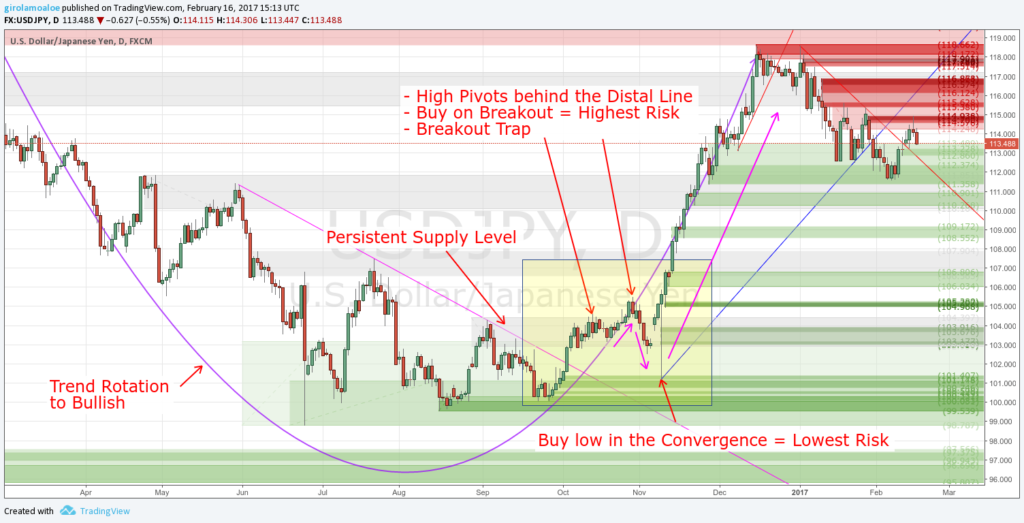
First of all, I don’t trade the breakouts so as I don’t trade the breakdown.
Despite people says to do it, trade the breakout carries an extreme risk.
The reason is that you are going to Buy high on the breakout where the risk is the highest. In the same way, you are going to Sell low on the breakdown.
You must expect a High Pivot or Low Pivot behind the Distal Line of a Persistent Supply or Demand Level.
In a Liquid Market, the Supply and Demand disparity on Breakouts can give bad trades.
Any Supply and Demand Trading System highlights the risk on investment around breakouts. The reason is that the risk is real.
The Breakout Trap on a Persistent Level is the market reaction to the new High Pivot behind the Distal Line.
This High Pivot changes the price range of the Original Imbalance of a Persistent Supply or Demand Level. The orders push the price back making visible the new Imbalance.
So, when you buy on the Breakout of the Persistent Level, you take an unacceptable risk. There are high chances that the price action traps your trade squeezing it and giving you a loss.
A Persistent Supply or Demand Level is like a “rubber gum”. It makes bounce back the price that converges, even when the price tries to go behind its Distal Line.
The right way is to Buy low when the price converges to a new demand in a breakout confirmation. This is even the way to trade the Trend Rotation. Or, you can consider to Trade the False Breakouts, when it is possible.
Conclusion
Many times I see people who say: There is a bullish engulf, it is strong, then I can buy.
They believe this is enough to make them profitable traders. Instead, the reality is quite different.
What people skip to take in consideration is the contest where an Imbalance occurs.
When the Trader doesn’t consider the Trading Scenario where the events occur, he is blind. So, it trades without know the occurrences in the Price Action.
Be aware that a clear comprehension of the Price Action is a MUST to earn money.
Supply and Demand Trading is not a way to trade without understanding the market.
Looking for a trading opportunity we look for a price range that hosts new and fresh levels in opposition.
The Persistent Level is crucial for a good trading practice. It has a concrete relevance in the trend rotation. From the other side, it hosts relevant trading opportunities when it is no more valid.
Trading is a job of probabilities. Nobody knows where the price will go, so as Nobody is smarter than the market.
We work with what we know. Then we use what we see to decide how to act, according to our trading style.
This is what I do sharing my experience with my students. To study with me what you have to do is join on Profiting.Me.
So, let me ask you some things:
- Did you ever think that the strong support or the strong resistance doesn’t work in your favor?
- How do you analyze a Trend Rotation in your Trading Practice?

Oleg says
Great blog by the way. I was looking for such level of info – its hard to find.
“Did you ever think that the strong support or the strong resistance doesn’t work in your favor?”
– It depends on a strategy used. Range traders love a strong support/resistance… I would like to know will this S/R hold or not.
“How do you analyze a Trend Rotation in your Trading Practice?”
I think you are asking about a trend change it direction. I use a trend lines, MA cross and higher high/higher lows approach.